Machine Learning (ML) Logistic Regression Exercises
Machine Learning (ML) Logistic Regression Practice Questions
When performing binary classification, using standard Linear Regression (OLS) can be problematic. Which of the following is a primary reason why Linear Regression is unsuitable for predicting probabilities?
Linear Regression is designed to predict continuous values across an infinite range (−∞ to +∞).
- Why Option 2 is correct: Probabilities must strictly stay between 0 and 1. Linear Regression can predict values like 1.2 or -0.5, which are nonsensical in a probability context.
- Why others are incorrect: Linear Regression is actually very fast computationally. It uses continuous features (not just categorical), and it can handle thousands of features simultaneously.
Quick Recap of Machine Learning (ML) Logistic Regression Concepts
If you are not clear on the concepts of Logistic Regression, you can quickly review them here before practicing the exercises. This recap highlights the essential points and logic to help you solve problems confidently.
Foundations of Logistic Regression in Machine Learning
Logistic Regression is a supervised learning algorithm designed for classification problems. Unlike Linear Regression, which predicts continuous values, Logistic Regression predicts the probability of a class and then maps that probability to a discrete label (such as 0 or 1).
It is widely used when the target variable is categorical, especially in binary classification tasks like: spam vs not spam, fraud vs non-fraud, or disease vs no disease.
- Input: Feature vector X (e.g., age, income, clicks, symptoms)
- Output: Probability that the instance belongs to a class (e.g., P(y=1))
- Final Prediction: Class label based on a probability threshold
Logistic Regression models the relationship between features and the log-odds of the target class using a linear equation, then converts that value into a probability using a non-linear function.
This combination of linear modeling and probabilistic output makes Logistic Regression both powerful and highly interpretable, which is why it is one of the most trusted algorithms in real-world machine learning systems.
Logistic Regression Mathematical Model
Logistic Regression starts by computing a linear combination of the input features, similar to Linear Regression. For an input vector X = (x₁, x₂, …, xₙ), the model calculates:
z = β₀ + β₁x₁ + β₂x₂ + … + βₙxₙ
This value z is called the logit. It represents the unbounded score that measures how strongly the input belongs to a class.
However, this raw linear output is not a probability. It can be any value from negative infinity to positive infinity, which is not suitable for classification.
To convert this score into a meaningful probability, Logistic Regression passes z through a special function called the sigmoid (logistic) function.
This design allows Logistic Regression to keep the simplicity of a linear model while producing outputs that can be interpreted as probabilities.
Sigmoid Function and Probability Mapping
The sigmoid function is the mathematical core of Logistic Regression. It takes the linear output z and converts it into a value between 0 and 1, which represents probability.
The sigmoid function is defined as:
σ(z) = 1 / (1 + e−z)
No matter how large or small z becomes, the sigmoid function always produces a value between 0 and 1. This makes it ideal for modeling probabilities.
- When z is very large → probability is close to 1
- When z is very small → probability is close to 0
- When z = 0 → probability is 0.5
The output of the sigmoid function is interpreted as: P(y = 1 | X), the probability that the input belongs to the positive class.
This probability-based output allows Logistic Regression to be used not only for classification but also for decision-making, risk scoring, and ranking.
Predicted Probability and Decision Boundary
After applying the sigmoid function, Logistic Regression produces a predicted probability for each input. This value represents how likely the input belongs to the positive class (usually labeled as 1).
To convert this probability into a class label, a decision threshold is used. The most common threshold is 0.5, but it can be adjusted based on the problem.
- If P(y = 1) ≥ 0.5 → Predict class 1
- If P(y = 1) < 0.5 → Predict class 0
The value where the probability equals 0.5 corresponds to the decision boundary. This is the point where the model is equally unsure between both classes.
In a one-feature problem, the decision boundary is a single point. In multiple dimensions, it becomes a line, plane, or hyperplane that separates the classes.
Changing the threshold allows control over false positives and false negatives, which is especially important in applications like fraud detection or medical diagnosis.
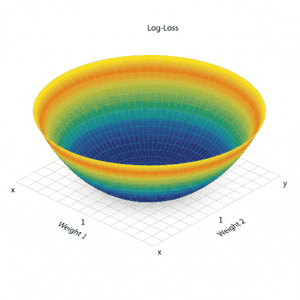
Logistic Regression Cost Function (Log Loss)
Logistic Regression does not use Mean Squared Error like Linear Regression. Instead, it uses a special loss function called Log Loss or Binary Cross-Entropy.
The Log Loss for a single training example is:
L = − [ y · log(p) + (1 − y) · log(1 − p) ]
Where:
- y = actual class (0 or 1)
- p = predicted probability of class 1
This loss function heavily penalizes confident wrong predictions. For example, predicting 0.99 when the true label is 0 leads to a very large error.
By minimizing Log Loss across all training data, Logistic Regression learns parameters that produce accurate and well-calibrated probabilities.
Gradient Descent Optimization in Logistic Regression
Logistic Regression learns its parameters by minimizing the Log Loss function. This is done using an iterative optimization algorithm called Gradient Descent.
At each step, the model updates its weights in the direction that reduces the loss the most. The update rule for each parameter β is:
β ← β − α · ∂L / ∂β
Where:
- α is the learning rate
- ∂L / ∂β is the gradient of the loss with respect to the parameter
The gradients depend on the difference between the predicted probability and the true label. When predictions are far from reality, the updates are larger.
Over many iterations, Gradient Descent gradually moves the parameters toward values that produce the best possible decision boundary.
Odds, Log-Odds, and Coefficient Interpretation
Logistic Regression predicts probabilities, but interpreting coefficients requires understanding odds and log-odds.
Odds: The ratio of the probability of an event occurring to it not occurring:
odds = P(y=1) / P(y=0)
Log-Odds (Logit): The natural logarithm of the odds:
logit(P) = log(P / (1 − P)) = β₀ + β₁x₁ + … + βₙxₙ
Each coefficient βᵢ represents the change in the log-odds of the outcome for a one-unit increase in xᵢ, holding all other features constant.
- Positive βᵢ → increases probability of class 1
- Negative βᵢ → decreases probability of class 1
- Exponentiating βᵢ gives the odds ratio, useful in business or medical interpretation
Understanding odds and log-odds makes Logistic Regression highly interpretable, which is one of its biggest advantages in applied machine learning.
Multiclass Logistic Regression
Logistic Regression can be extended beyond binary classification to handle multiple classes. Two common approaches are:
- One-vs-Rest (OvR / One-vs-All): Train a separate binary classifier for each class, treating it as positive and all others as negative. The class with the highest probability is selected.
- Softmax Regression (Multinomial Logistic Regression): Generalizes logistic regression to predict probabilities for all classes simultaneously using the softmax function:
Softmax function:
P(y=j|X) = ezj / Σk ezk
Here, zj is the linear score for class j, and the denominator sums over all classes. This ensures that the predicted probabilities sum to 1.
OvR is simpler and works well for small numbers of classes, while softmax is more suitable when classes are mutually exclusive and probabilities need to be properly normalized.
Model Assumptions in Logistic Regression
For Logistic Regression to perform well, certain assumptions about the data should hold:
- Linearity in the log-odds: The relationship between features and the logit (log-odds) should be linear.
- Independence of observations: Each sample should be independent of the others.
- No multicollinearity: Features should not be highly correlated, as this can distort coefficient estimates.
- Large sample size: Logistic Regression requires sufficient data for stable and reliable estimates.
Violating these assumptions can lead to unreliable predictions or unstable model coefficients. Techniques like feature selection, transformation, or regularization can help mitigate issues.
Common Problems in Logistic Regression
Logistic Regression is simple and interpretable, but several challenges can affect its performance:
- Class imbalance: When one class is much more frequent than another, the model may be biased toward the majority class.
- Overfitting: Too many features relative to the number of samples can cause the model to fit noise.
- Decision threshold issues: Using 0.5 as the threshold may not be optimal for all problems; adjusting thresholds can balance false positives and negatives.
- Outliers: Extreme feature values can distort the decision boundary.
Awareness of these problems allows for preemptive actions like using regularization, balancing classes, or adjusting thresholds to improve model reliability.
Regularized Logistic Regression
Regularization helps prevent overfitting in Logistic Regression by penalizing large coefficients. It adds a constraint to the loss function, encouraging simpler models.
Two common types of regularization are:
- L2 Regularization (Ridge): Adds the sum of squared coefficients to the loss:
Cost = Log Loss + λ Σ βᵢ² - L1 Regularization (Lasso): Adds the sum of absolute coefficients to the loss:
Cost = Log Loss + λ Σ |βᵢ|
This can shrink some coefficients to zero, effectively performing feature selection.
Key points:
- Reduces overfitting and improves generalization
- Controls model complexity
- Helps manage multicollinearity and irrelevant features
- Regularization strength λ is tuned via cross-validation
Real-World Applications of Logistic Regression
Logistic Regression is widely used because of its simplicity, interpretability, and ability to output probabilities. Common applications include:
- Spam Detection: Classifying emails as spam or not spam.
- Fraud Detection: Identifying fraudulent transactions in banking or e-commerce.
- Medical Diagnosis: Predicting the presence or absence of a disease based on patient data.
- User Churn Prediction: Determining whether a customer will leave a service.
- Credit Scoring: Evaluating the probability of loan default for applicants.
- Marketing Campaigns: Predicting whether a user will respond to a campaign or click an ad.
Its probabilistic output and coefficient interpretability make it especially useful in industries where understanding model decisions is critical.
Summary of Logistic Regression
Logistic Regression is a fundamental supervised learning algorithm used for classification problems. It models the probability that an input belongs to a particular class using a linear combination of features and a sigmoid function.
- Predicts probabilities and maps them to discrete class labels using a threshold.
- Uses the sigmoid function to constrain outputs between 0 and 1.
- Optimizes parameters using Gradient Descent and the Log Loss (Binary Cross-Entropy) function.
- Coefficients can be interpreted using odds and log-odds.
- Regularization (L1/L2) helps prevent overfitting and manage multicollinearity.
- Supports binary and multiclass classification using OvR or softmax approaches.
- Assumptions include linearity in log-odds, independence, and no multicollinearity.
Logistic Regression combines simplicity, interpretability, and effectiveness, making it a widely trusted algorithm in many real-world classification problems.
Key Takeaways of Logistic Regression
- Used for classification problems, predicting probabilities for discrete classes.
- Transforms linear combination of features into probability using the sigmoid function.
- Binary classification uses a decision threshold (commonly 0.5) to assign class labels.
- Cost function is Log Loss (Binary Cross-Entropy), not MSE.
- Optimized via Gradient Descent or other iterative methods.
- Coefficients can be interpreted via odds and log-odds.
- Supports multiclass problems via One-vs-Rest or Softmax regression.
- Regularization (L1/L2) helps reduce overfitting and manage feature importance.
- Assumptions include linearity in log-odds, independence, no multicollinearity, and sufficient sample size.
- Applications include spam detection, fraud detection, medical diagnosis, credit scoring, and churn prediction.
About This Exercise: Logistic Regression
Logistic Regression is one of the most important supervised learning algorithms used for classification problems in machine learning. On Solviyo, these Logistic Regression exercises and MCQs help learners understand how binary and multi-class classification models work in real-world scenarios.
This topic is specially designed for students, job seekers, and developers who want to master classification algorithms using practical, concept-driven learning.
What You Will Learn from These Logistic Regression Exercises
- How Logistic Regression is used for classification in machine learning
- The role of the sigmoid (logistic) function in predicting probabilities
- Understanding decision boundaries and classification thresholds
- How model coefficients and bias affect predictions
- The difference between Logistic Regression and Linear Regression
Key Machine Learning Concepts Covered
These Logistic Regression MCQs and exercises cover both theory and applied machine learning concepts used in data science and AI projects.
- Binary classification and multi-class classification
- Log loss (cross-entropy loss) and model evaluation
- Probability estimation using sigmoid activation
- Overfitting and model performance in classification tasks
- Use of Logistic Regression in predictive analytics
Why Practice Logistic Regression on Solviyo
Solviyo provides a focused and interactive way to practice Logistic Regression through carefully designed multiple-choice questions and logic-based problems.
- No coding environment required — learn by reasoning and concepts
- MCQs designed for exams, interviews, and skill assessments
- Clear explanations for every Logistic Regression question
- Ideal for machine learning beginners and intermediate learners
Who Should Use These Logistic Regression MCQs
These Logistic Regression practice questions are perfect for anyone preparing for machine learning interviews, data science exams, or AI certifications.
- Students learning supervised learning and classification algorithms
- Machine learning beginners building a strong foundation
- Data science aspirants preparing for technical interviews
- Professionals revising predictive modeling concepts
How This Topic Fits into Machine Learning
Logistic Regression is often the first classification algorithm learned in machine learning because it is simple, powerful, and widely used in real-world applications like spam detection, medical diagnosis, and fraud detection.
By practicing these Logistic Regression exercises on Solviyo, you will gain the confidence to understand how classification models make decisions and how probabilities are transformed into predictions in modern machine learning systems.